
ROLE
UX/UI Designer, UX Research, Branding
TOOLS
Figma, Illustrator, Procreate
TIMEFRAME
September - October 2025
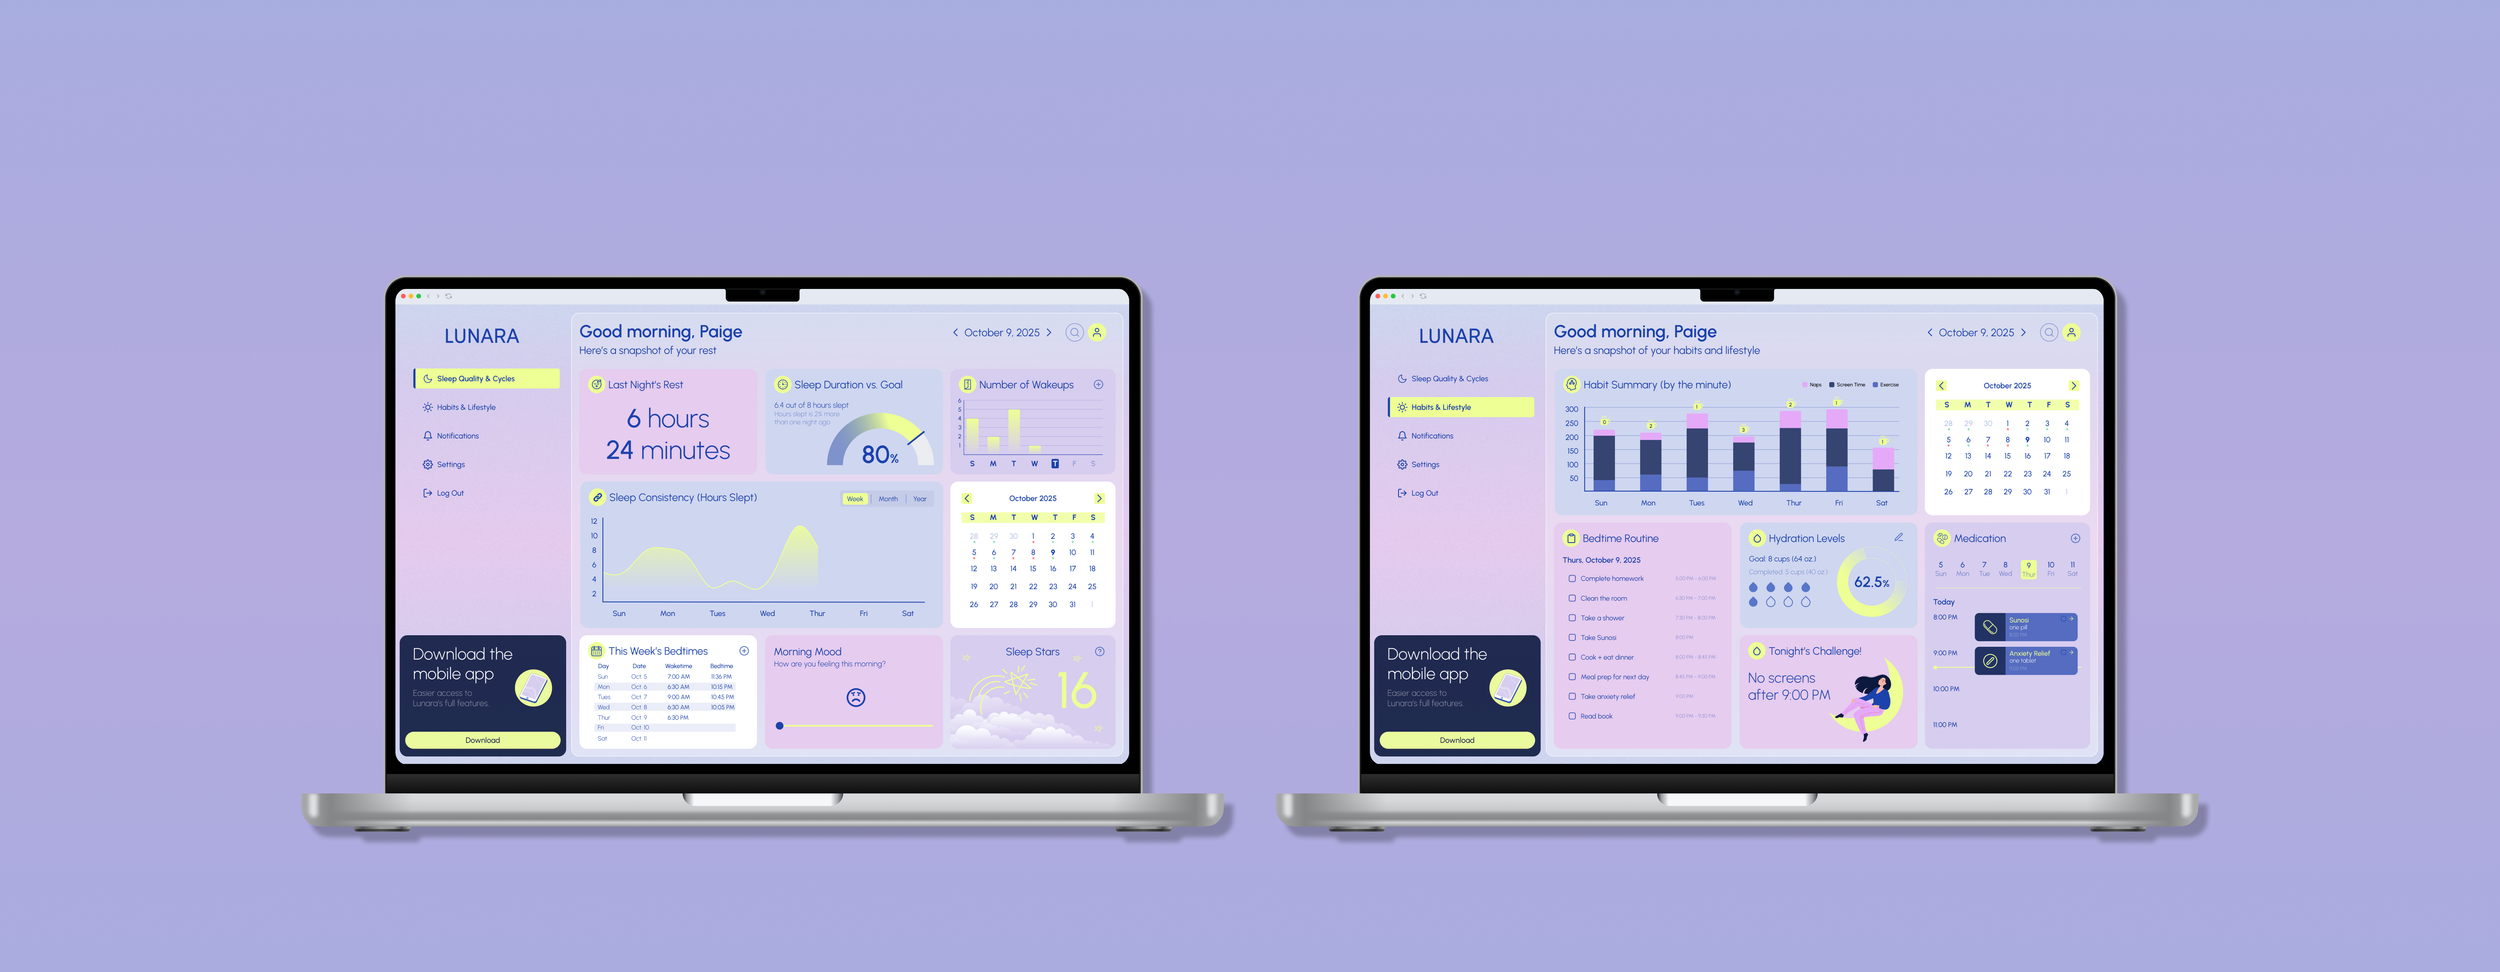
lunara
dashboard design
Many users struggle to decipher the relationship between their daily lifestyle choices and their nocturnal recovery. Existing sleep-tracking applications are often clinical, data-heavy, or overly generic. LUNARA is a calming, intuitive dashboard ecosystem designed to help users track, visualize, and optimize their sleep hygiene through human-centered design and rewarding interactions.
The challenge
transform intimidating, clinical sleep data into an accessible and rewarding narrative that encourages long-term habit formation
Design process
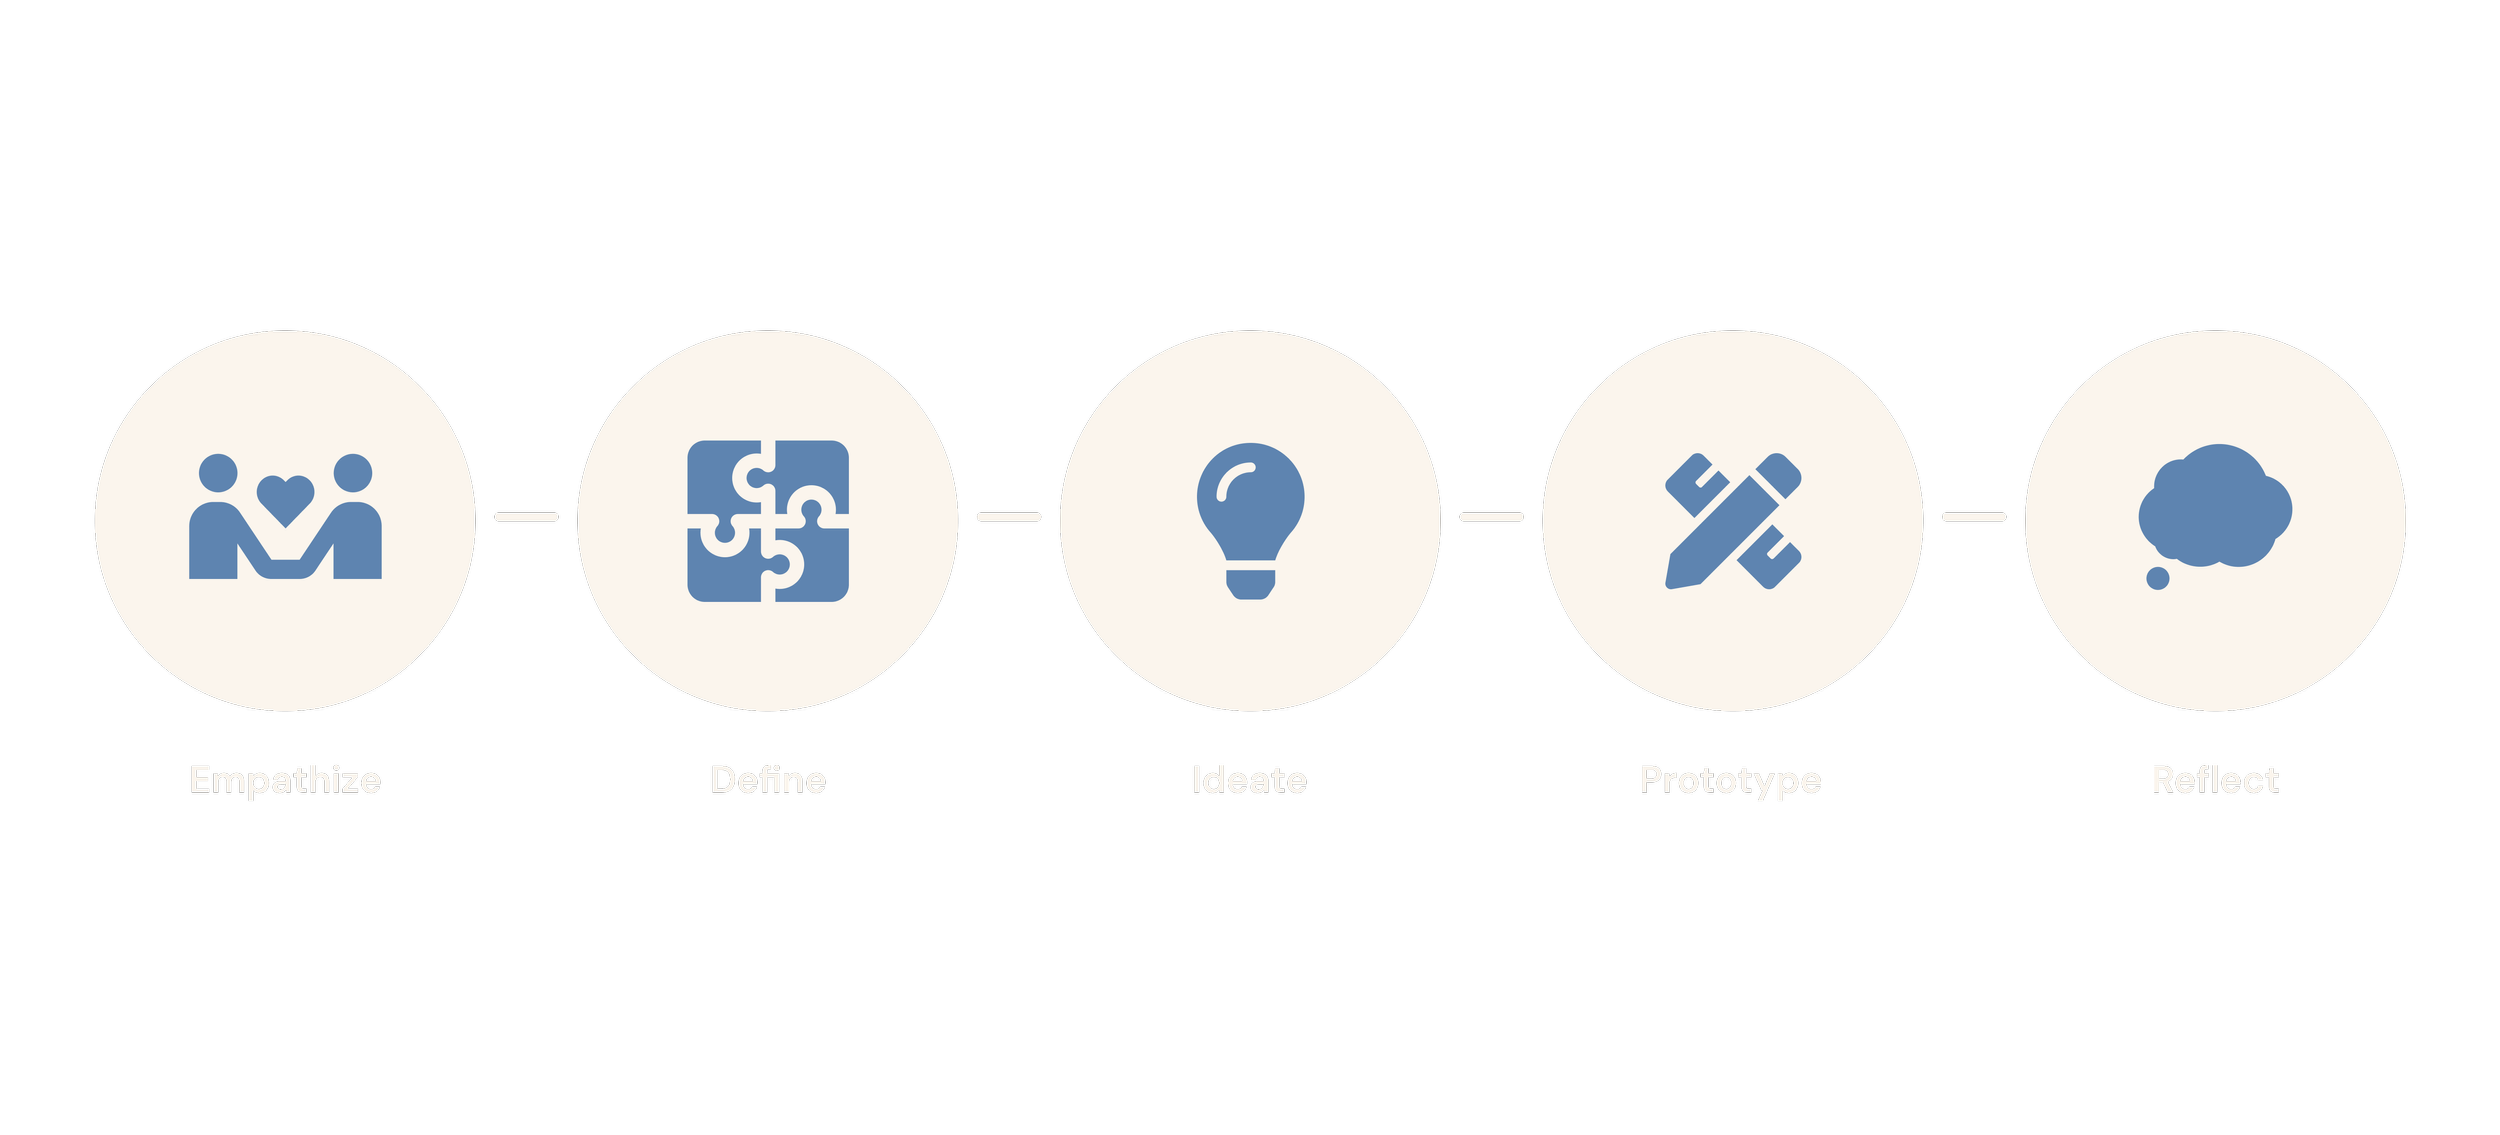
OVERVIEW
User Research
Approach
empathize
User research
Research for Lunara began by exploring the gap between the fundamental importance of sleep and its frequent neglect in high-stress, screen-heavy lifestyles. I investigated the "medical" feel of current sleep tools, which often alienate users rather than encouraging them. This phase focused on identifying how to transform complex data into approachable, meaningful insights that help busy individuals recognize the direct link between their daily habits and their overall well-being.
approach
I conducted qualitative user interviews to better understand the emotional and logistical hurdles of maintaining a consistent sleep schedule. This approach allowed me to move beyond raw numbers and uncover the specific motivations behind habit formation. By speaking directly with target users, I validated the need for a simplified interface and identified that gamification—such as streaks and rewards—was a high-priority feature for sustaining long-term engagement.
main interview questions
Walk me through your typical evening routine. What are the biggest stressors or distractions that usually prevent you from getting to bed on time?
Have you used sleep or health tracking apps before? If so, what about those tools felt too 'medical' or overwhelming for your daily use?
How do you currently track daytime habits (like caffeine, stress, or screen time) and the quality of your rest the next morning?
When trying to stick to a new habit, do you find digital incentives like 'streaks' or achievement badges helpful, or do they feel like added pressure?
If you had a single dashboard to check your sleep health in the morning, what are the top three metrics you would need to see to feel 'informed' without feeling overwhelmed?
OVERVIEW
Key Insights
User Personas
Journey Map
define
key insights
habitual clarity
Users need to see the direct correlation between lifestyle triggers and sleep quality.
sustained engagement
Motivational triggers, such as streaks are essential for habit formation.
PLANNING BURNOUT
cognitive ease
Data visualization should reduce the user's mental load before bed or upon waking.
User personas
I mapped the user’s emotional arc from the evening "wind-down" to the morning "reflection" phase. This helped identify critical windows where the app could intervene with suggestions without being intrusive.
journey map
OVERVIEW
Information Architecture
Iterative Design
ideate
information architecture
The IA was structured to prioritize the "Sleep Score" as the primary key performance indicator (KPI), with secondary nodes for trend analysis, habit logging, and community challenges.
Ideation & Iterative Design
After research was complete, sketching to get design ideas out was the first step. I drafted four key screens that users had the most trouble on. Pen to paper made all the difference in sparking ideas and getting started. This helped organize the research and my design ideas before designing in Figma.
design system
OVERVIEW
The Final Solution
Core Features
Prototype
prototyping
the final solution
The LUNARA Dashboard provides a seamless, data-rich yet digestible experience, empowering users to take control of their sleep health.
Core features
calming visuals
A high-contrast, dark-mode interface designed to reduce eye strain and support melatonin production.
gamified progress
Reward systems that turn habit-building into an engaging and low-pressure game.
PLANNING BURNOUT
interactive data
Dynamic charts that transform sleep cycle data into easy-to-understand visual stories.
custom insights
Tailored suggestions based on individual patterns, bridging the gap between data and lifestyle.
By focusing on usability, clarity, and visual appeal, the dashboard presents sleep data in an engaging, intuitive manner, encouraging users to track their habits consistently and take proactive steps toward better sleep.
OVERVIEW
Retrospective
Reflect
Retrospective
The LUNARA project reinforced the critical role of emotional design when dealing with complex biometric data. By shifting the visual language from a cold, "medical" aesthetic to an approachable, lifestyle-oriented dashboard, I was able to transform intimidating statistics into actionable health insights.